Visualization and exploration of time-varying medical image data sets


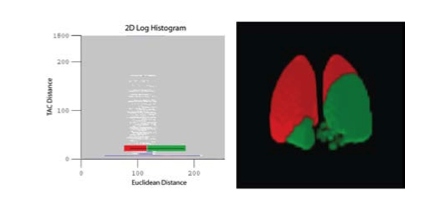
In this work, we propose and compare several methods for the vi- sualization and exploration of time-varying volumetric medical im- ages based on the temporal characteristics of the data. The principle idea is to consider a time-varying data set as a 3D array where each voxel contains a time-activity curve (TAC). We define and appraise three different TAC similarity measures. Based on these measures we introduce three methods to analyze and visualize time-varying data. The first method relates the whole data set to one template TAC and creates a 1D histogram. The second method extends the 1D histogram into a 2D histogram by taking the Euclidean distance between voxels into account. The third method does not rely on a template TAC but rather creates a 2D scatter-plot of all TAC data points via multi-dimensional scaling. These methods allow the user to specify transfer functions on the 1D and 2D histograms and on the scatter plot, respectively. We validate these methods on syn- thetic dynamic SPECT and PET data sets and a dynamic planar Gamma camera image of a patient. These techniques are designed to offer researchers and health care professionals a new tool to study the time-varying medical imaging data sets.
 Top
Top
- Fang, Zhe
- Möller, Torsten
- Hamarneh, Ghassan
- Celler, Anna
Top
Category |
Paper in Conference Proceedings or in Workshop Proceedings (Full Paper in Proceedings) |
Event Title |
Graphics Interface 2007 |
Divisions |
Visualization and Data Analysis |
Subjects |
Computergraphik |
Event Location |
Montreal |
Event Type |
Conference |
Event Dates |
28 - 30 May 2007 |
Date |
May 2007 |
Export |
Top
