Visualization of Time-Varying MRI Data for MS Lesion Analysis


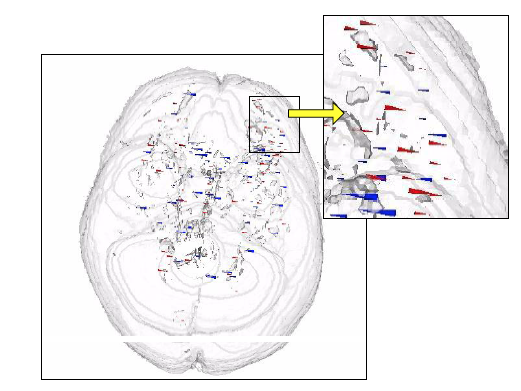
Conventional methods to diagnose and follow treatment of Multiple Sclerosis require radiologists and technicians to compare current images with older images of a particular patient, on a slice-by-slice basis. Although there has been progress in creating 3D displays of medical images, little attempt has been made to design visual tools that emphasize change over time. We implemented several ideas that attempt to address this deficiency. In one approach, isosurfaces of segmented lesions at each time step were displayed either on the same image (each time step in a different color), or consecutively in an animation. In a second approach, voxel-wise differences between time steps were calculated and displayed statically using ray casting. Animation was used to show cumulative changes over time. Finally, in a method borrowed from computational fluid dynamics (CFD), glyphs (small arrow-like objects) were rendered with a surface model of the lesions to indicate changes at localized points.
 Top
Top
- Tory, Melanie
- Möller, Torsten
- Atkins, M. Stella
Top
Category |
Paper in Conference Proceedings or in Workshop Proceedings (Full Paper in Proceedings) |
Event Title |
SPIE International Symposium on Medical Imaging |
Divisions |
Visualization and Data Analysis |
Subjects |
Computergraphik |
Event Location |
San Diego, California |
Event Type |
Conference |
Event Dates |
February 17 |
Date |
February 2001 |
Export |
Top
