An Interactive Analysis and Exploration Tool for Epigenomic Data


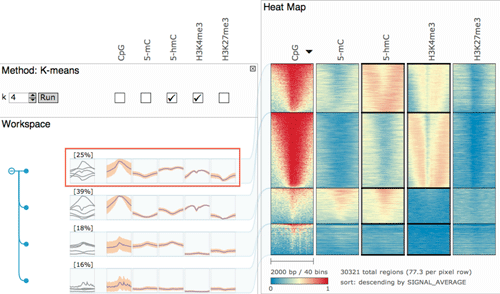
In this design study, we present an analysis and abstraction of the data and tasks related to the domain of epigenomics, and the design and implementation of an interactive tool to facilitate data analysis and visualization in this domain. Epigenomic data can be grouped into subsets either by k-means clustering or by querying for combinations of presence or absence of signal (on/off) in different epigenomic experiments. These steps can easily be interleaved and the comparison of different workflows is explicitly supported. We took special care to contain the exponential expansion of possible on/off combinations by creating a novel querying interface. An interactive heat map facilitates the exploration and comparison of different clusters. We validated our iterative design by working closely with two groups of biologists on different biological problems. Both groups quickly found new insight into their data as well as claimed that our tool would save them several hours or days of work over using existing tools.
 Top
Top
- Younesy, Hamidreza
- Nielsen, Cydney B.
- Möller, Torsten
- Alder, Olivia
- Cullum, Rebecca
- Lorincz, Matthew C.
- Karimi, Mehdi M.
- Jones, Steven J. M.
Top
Category |
Journal Paper |
Divisions |
Visualization and Data Analysis |
Journal or Publication Title |
Computer Graphics Forum: the international journal of the Eurographics Association |
ISSN |
0167-7055 |
Page Range |
pp. 91-100 |
Number |
3pt1 |
Volume |
32 |
Date |
June 2013 |
Export |
Top
