GEMSe: Visualization-Guided Exploration of Multi-channel Segmentation Algorithms


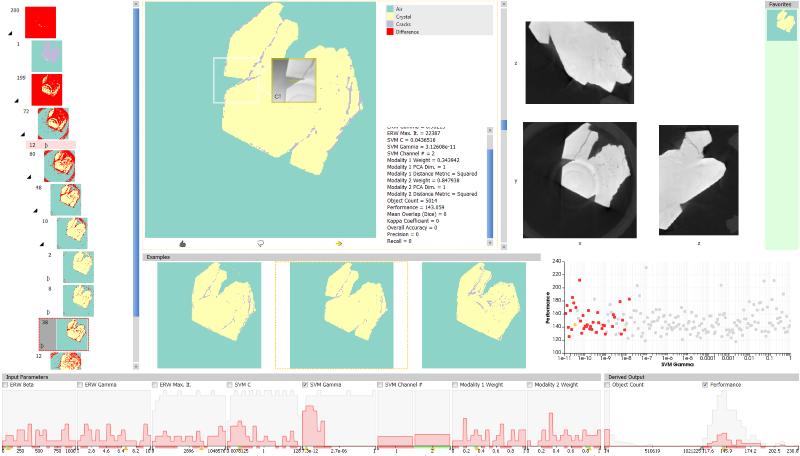
We present GEMSe, an interactive tool for exploring and analyzing the parameter space of multi-channel segmentation algorithms. Our targeted user group are domain experts who are not necessarily segmentation specialists. GEMSe allows the exploration of the space of possible parameter combinations for a segmentation framework and its ensemble of results. Users start with sampling the parameter space and computing the corresponding segmentations. A hierarchically clustered image tree provides an overview of variations in the resulting space of label images. Details are provided through exemplary images from the selected cluster and histograms visualizing the parameters and the derived output in the selected cluster. The correlation between parameters and derived output as well as the effect of parameter changes can be explored through interactive filtering and scatter plots. We evaluate the usefulness of GEMSe through expert reviews and case studies based on three different kinds of datasets: A synthetic dataset emulating the combination of 3D X-ray computed tomography with data from K-Edge spectroscopy, a three-channel scan of a rock crystal acquired by a Talbot-Lau grating interferometer X-ray computed tomography device, as well as a hyperspectral image.
 Top
Top
- Fröhler, Bernhard
- Möller, Torsten
- Heinzl, Christoph
Top
Category |
Journal Paper |
Divisions |
Visualization and Data Analysis |
Journal or Publication Title |
Eurographics + EG EuroVis // Computer Graphics Forum: (Journal of the Eurographics Association) |
ISSN |
0167-7055 |
Publisher |
Wiley & Sons Ltd. |
Page Range |
pp. 191-200 |
Number |
3 |
Volume |
35 |
Date |
June 2016 |
Export |
Top
